
Unpacking the Stock Market Chaos:
How the Bond Market Turned Upside Down in Just 14 Days!
To gain an understanding of what happened in the market over the last 2-weeks, so we can try and predict what the next 3-months will hold we need to look at the following:
-
the Stock Market
-
Bond Market, and
-
Trump (of course)
We’ve known about Trump’s big tariff announcement on April 2nd for some time now, and I think it still caught many people off guard, myself included!
When a professional investor hears the word tariff, they immediately think”
“The businesses I’m invested in will earn less income in the upcoming years due to tariffs.
This means the current price for my business will decline in the future.
I should sell my investment now, while the stock price for my business is still high.”
When earnings decrease, or are expected to decrease, the majority of investors believe their business’s stock price will decrease so they decide to sell their risky (stock) investments.
But what happens after they sell their stock? They need to put that money into something.
This is where Bonds come into play. When there is uncertainty in the stock market. Investors sell their riskier stock portfolio and buy less risky assets like bonds.
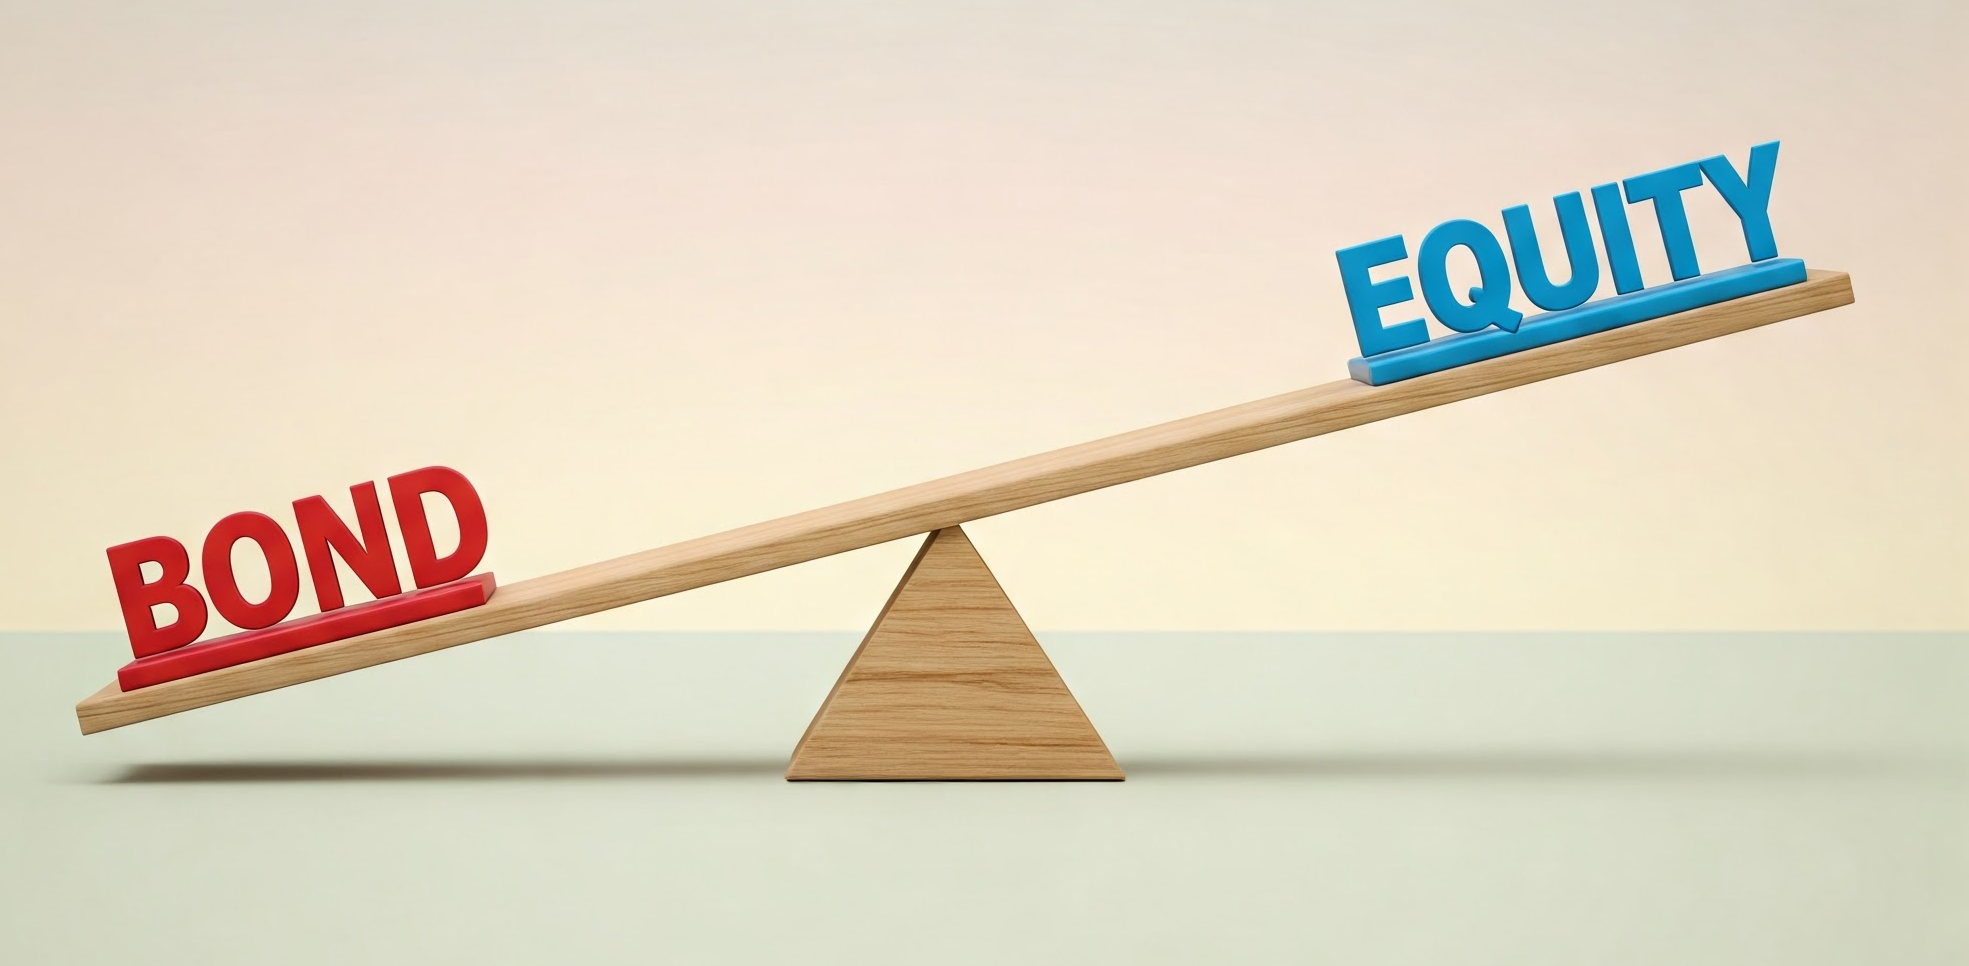
SeeSaw Bonds & Equity
Every investor’s portfolio is made up of some stocks and some bonds. Think of it like a teeter-totter.
- The more inclined you are to take on risk, the more stocks and less bonds you’ll have in your portfolio.
- The less inclined you are to risk, the less stocks and more bonds you’ll have in your portfolio.
What Did We Witness Over The Last 2-Weeks?
We need to study the following charts:
-
The S&P 500 – This is a decent representation of the US stock market.
-
Canada’s 5-Yr Government Bonds – This is where Canada’s less risky money flows into. It follows similar movements to the US government bond, and helps us predict movements with Canada’s fixed mortgage rates.
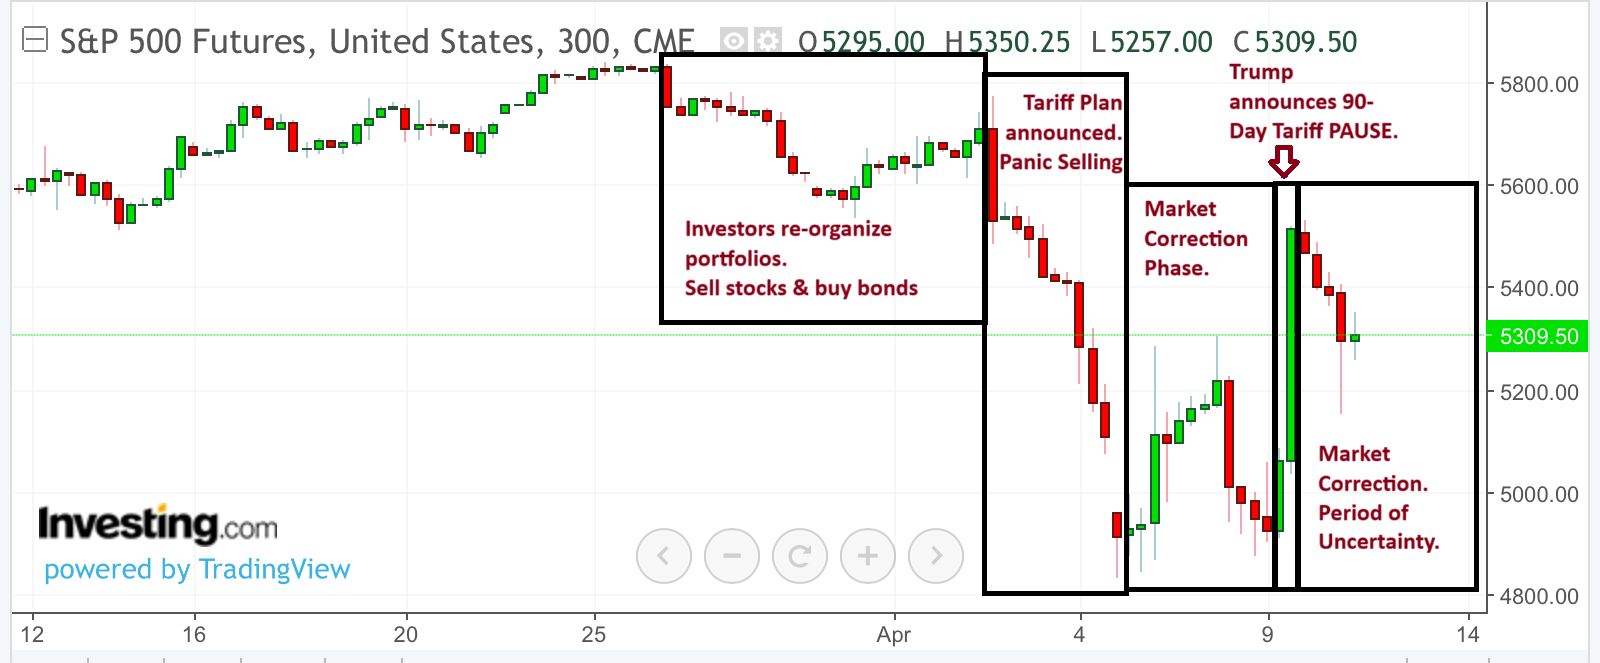
S&P 500 Analysis
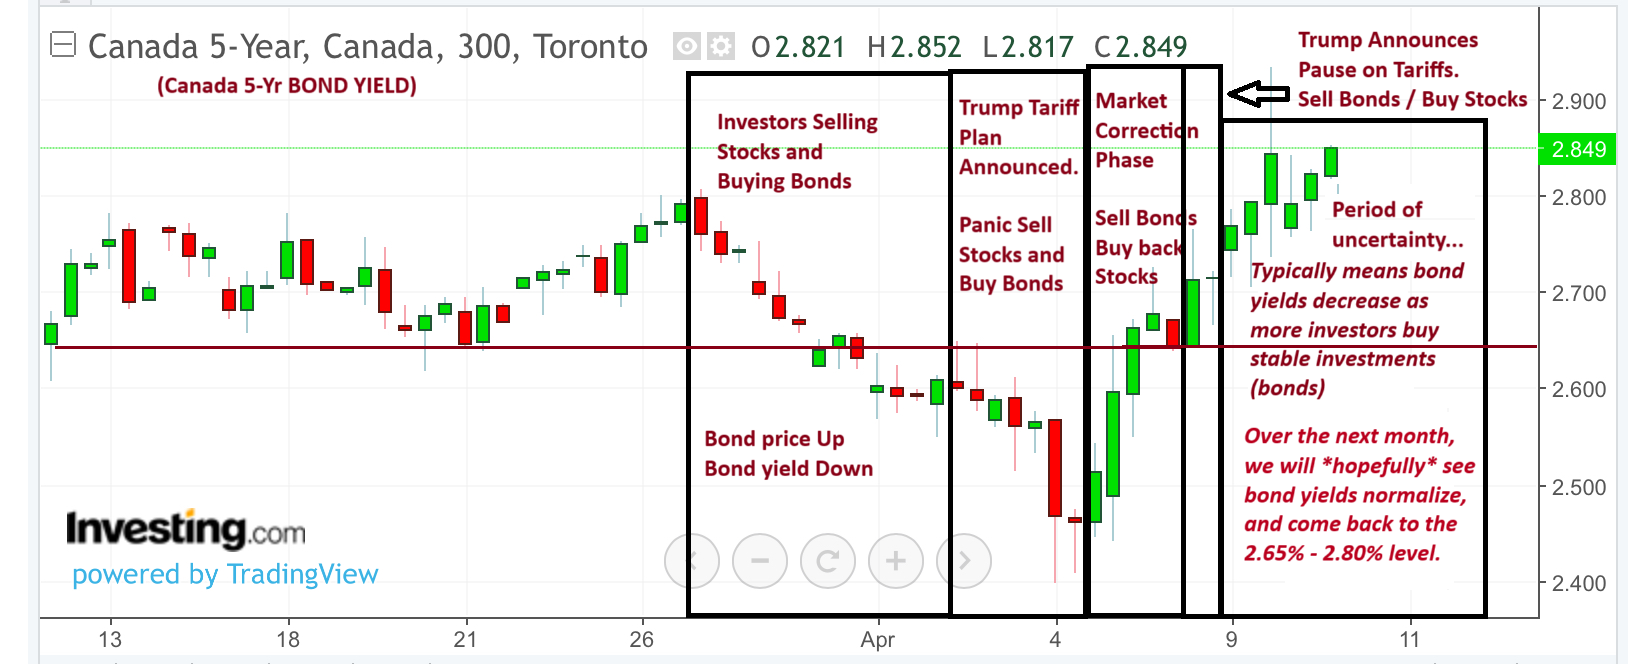
Bond Yield Analysis
***Critical Information for Understanding These Charts***
Unlike the stock market that shows the increase/decrease of stock prices. The Bond chart shows the “yield.”
A bond’s yield is the return an investor will receive on their investment.
-
When an investor pays more for a bond, they actually receive a lower return (yield) on their investment because they’ve essentially over-paid.
-
When an investor pays less for a bond, they will receive a higher return (yield) on their investment, because they’ve under-paid.
It’s a little confusing, but try thinking of it like this:
-
Whenever the “yield” is decreasing, that means a lot of people want to buy this investment so the seller can charge a higher price and people will pay it!
-
Whenever the “yield” is increasing, that means less people want to buy the bond so the seller has to decrease their price to sell their investment.
Time Line of Events
Phase 1 – The week leading up to the big tariff announcement
Entering the week before the Tariff announcement, we saw investors re-organize their investment portfolios and start selling off some of their stocks and buying bonds.
There was uncertainty on who/what and how much the Tariff announcement will impact the market, so investors were leery about overselling their stock positions.
-
Increased Demand for Bonds
-
Bond prices rise 🔼 / Bond yields fall 🔽
-
-
Lower demand for stocks
-
S&P 500 price falls 🔽
-
Phase 2: Trump Announces Tariff Plan, rollout
After Trump announced his tariff plan, the market panics and downgrades future earnings from companies.
Investors panic sell their stocks and panic buy bonds.
-
Massive demand for Bonds
-
Bond Prices spike ⏫ / Bond Yields drop ⏬
-
-
No demand for Stocks
-
S&P 500 price drops ⏬
-
Phase 3: Week after Tariff Announcement
The week after the Tariff announcement there was a market correction. Dust starts to settle, and investors re-organize their portfolios.
Investors are now betting the market was oversold. They cautiously start selling some of their bonds and re-purchasing stocks at a discount.
-
Lower demand for bonds
-
Bond Prices fall 🔽 / Bond Yields rise 🔼
-
-
Increased demand for stocks
-
S&P 500 price rises 🔼
-
Phase 4: April 9 – Breaking News -Tariff PAUSED until July 9!
A full week after the market mania, Trump makes headlines announcing he’s PAUSING tariffs for 90-days (July 9).
Investors quickly realize there is an opportunity to buy-back their stock portfolio at a steep discount. Once again, investors quickly sell their bonds and buy stocks
-
No demand for bonds
-
Bond Prices drop ⏬ / Bond Yields Spike ⏫
-
-
Huge demand for stocks
-
S&P 500 prices spikes ⏫
-
Phase 5: Uncertainty & Volatility (future prediction)
The market has likely oversold their bond portfolio and over-bought their stock portfolio.
There are many speculations and rumors as to why the bond portfolio is assumed to be oversold.
The main point, over the coming weeks we should see some funds flow back towards the bonds, bringing the yields back inline to where they were before this whole mess.
What does this mean for Mortgage Rates?
Bond yields are up +0.25% from where they were in mid-March, and some lenders have already increased their fixed mortgage rates.
There is going to be A LOT of uncertainty in the bond market leading up to Trump’s tariffs on July 9th.
But, as we’ve seen before, all this change with one tweet, or if some major trade deals are made by then.
Bank of Canada is still expected to decrease the VARIABLE INTEREST RATE.
However, I don’t foresee the Bank of Canada’s expected rate decrease to have much of an impact on fixed mortgage rates at this time since bond yields are now +0.25% higher than where we started in mid-March.
There is still a possibility we could see lower fixed rates in June as we get closer to the Tariff date in July.
Feel free to reach out if you have any questions – 778-215-4121.
Best,
Adam Sale