How Vancouver’s Housing Market Defies Recessions
You might think that a recession would automatically lead to a drop in housing prices, especially in a city like Vancouver where the cost of living is notoriously high. But you would be wrong. In fact, Vancouver’s housing market has shown remarkable resilience and even growth in the face of economic downturns. How is this possible? Let me show you the surprising facts I discovered while researching this topic.
What is a Recession?
Before we dive into the data, let’s clarify what we mean by a recession. A recession is defined as two consecutive quarters of declining real GDP (economic output) and an increasing unemployment rate. There is no fixed threshold for the unemployment rate to indicate a recession, but historically, we tend to see recessions when unemployment is in the high 6% range.
The Mistake I Made
I assumed that finding a correlation between recessions and housing prices would be easy. After all, it makes sense that people would have less money to spend on housing when the economy is struggling. But I was wrong. I made a common mistake: I looked at Vancouver’s housing prices in relation to the Canadian economy as a whole. But that was too broad. I needed to narrow down my data to BC only.
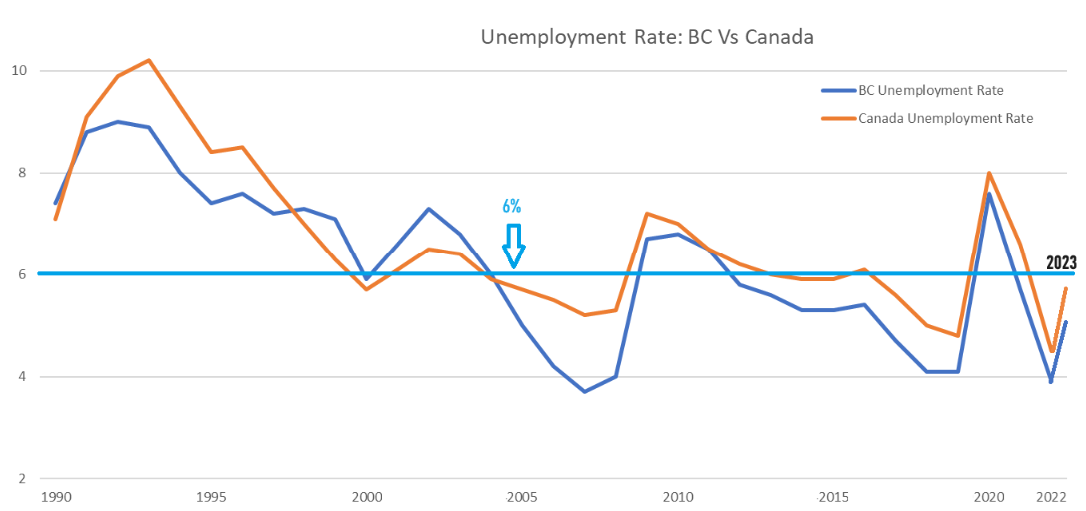
Canada and BC unemployment rate from 1990 to December 2023
Unemployment Rates
Canada is a huge country, and each province has a different mix of industries. This means that some provinces are more vulnerable to recessions than others. For example, remember when oil prices crashed in 2016? Alberta’s unemployment rate soared to 8% and their real estate market plummeted; meanwhile, Vancouver was enjoying a housing boom. This made me wonder: how does BC’s unemployment rate compare to the national average?
The answer is: much better.
Since 2005, BC’s unemployment rate has been consistently lower than Canada’s national average, and this is largely due to the amount of investment BC received since 2002. In the early 2000s, BC started to diversify its economy and boost its industries. BC now has a robust and balanced economy that offers jobs in mining, construction, natural gas, forestry, technology, film, tourism, and more. This means that BC is less affected by industry slowdowns and more resilient to recessions.
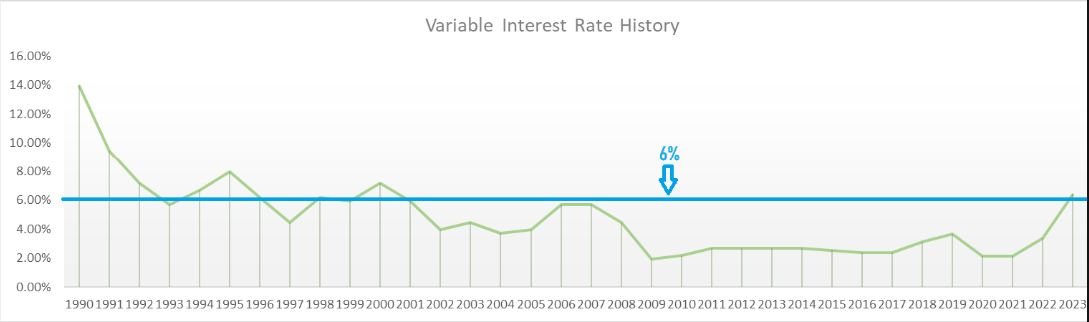
Lowest Variable Rate Available from 1990 to Dec 2023
Interest Rates
Another factor that influences housing prices is interest rates. There is a well-known saying that goes: “When interest rates are rising, house prices are falling.” This is true in most parts of the province, but not necessarily in Vancouver.
Vancouver’s housing market is proving to withstand higher interest rates without showing a noticeable decline in prices, and in most neighborhoods, these prices are continuing to slowly increase.
It is only when interest rates exceed 6% that we notice a slowdown in sales activity. Slower sales activity over a long enough time-frame creates a build-up of supply leading to a decline in housing prices.
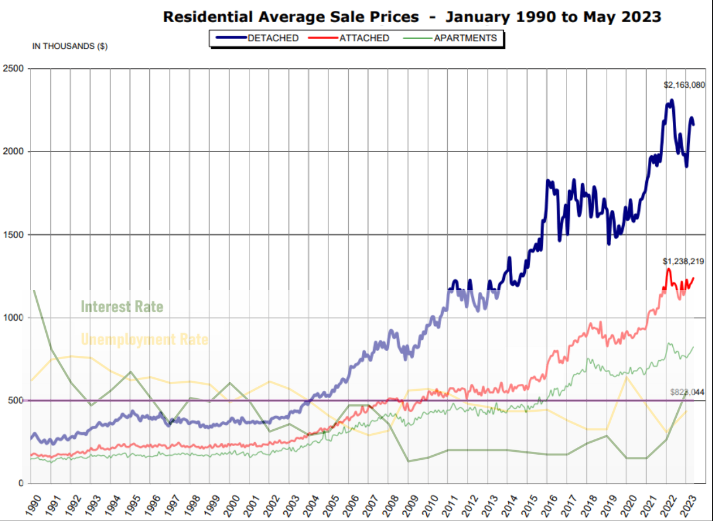
Greater Vancouver’s housing prices in relation to Interest rates and unemployment rates
The Pattern
Based on these two factors: BC’s unemployment rate and interest rates, we see a pattern emerge in Vancouver’s Housing Prices:
- Unemployment rate exceeds 6%, and interest rates are under 6% – Housing Prices are Stagnant or Rising slightly
- Interest rates above 6%, and unemployment rate under 6% – Housing Prices are Stagnant or Rising slightly
- Unemployment rate & interest rates above 6% – Housing Prices Decline.
To illustrate these patterns in more detail, I have overlaid the variable interest rate and BC’s unemployment rate on top of Vancouver’s historical housing price data. Pay attention to how the RED LINE interacts with these two factors. The RED LINE represents townhouses, which are a better representation of the overall Vancouver market due to a larger market. The detached housing market is represented by the BLUE LINE and sees wild swings in valuations due to the smaller market size (think affordability).
Vancouver’s Housing History: How It Survived Recessions and Boomed
Let’s look at the last 33 years of Vancouver’s housing prices and how they were affected by recessions, interest rates, and other factors.
1990 – 1993 Recession
This was the most severe recession in recent history, as BC’s unemployment rate reached 9% and interest rates soared to 14% before falling to 6% by 1993. As a result, housing prices in Vancouver dropped, but only for a short while. Townhouses and condos bounced back by 1992, and detached houses followed suit by 1993.
1994 – 2000 Low Economic Growth
This was a period of sluggish economic growth and low investment in BC, as interest rates and unemployment remained above 6%. Vancouver’s housing prices stagnated during this time, showing little change or growth.
2000 – 2008 Economic Expansion
This was a golden era for BC’s economy, as it attracted investment and diversified its industries. The unemployment rate dropped from 6.5% to 4%, and interest rates also went down from 6% to 4%. This created a favorable environment for housing prices, which increased by more than 50% in this period.
Financial Crisis – 2008 – 2010
This recession was primarily caused by Canada’s biggest trading partner (USA). As trade slowed between Canada and the US, BC’s unemployment rate peaked (briefly) at 6.8% and housing prices fell by 10% – 15%. They reached their lowest point in 2009, but recovered quickly by 2010. The Bank of Canada lowered interest rates to 2% to stimulate the economic growth, this helped revive the housing market. By 2010 housing prices recovered.
Housing Boom – 2010 – 2016
With unemployment rate in the high 5% range and ultra-low interest rates, Greater Vancouver’s townhome/condo prices (surprisingly) remained relatively stable until 2015. From 2015 onwards, lack of supply, low unemployment rates, and low interest rates created a housing boom in all segments.
The Outlier: Stress-Test – Late 2016
The stress-test was a policy change that rocked the national housing market, as the banks introduced stricter lending guidelines to reduce the risk of a financial crisis due to high income-to-debt levels. The stress-test makes it difficult for borrowers to get a mortgage from a prime lender that is greater than five times their annual income. This policy created uncertainty in real-estate market leading to slower sales activity. It took a little over a year for supply to build-up and materialize in Vancouver’s housing prices. For the first time in 30 years, Vancouver’s housing prices were affected purely based on government policy.
Covid Recession and Housing Boom – 2020 – 2022
This was the shortest recession on record, due to the covid lockdowns, lasting from February to April 2020. The Bank of Canada cut interest rates to spur economic activity, and this led to a surge in housing prices due to cheap debt. However, in 2022, inflation became a problem, and the Bank of Canada raised interest rates by 4.75% over 18 months, cooling the housing market due to higher borrowing costs and economic uncertainty.
Where Do We Go from Here?
One thing we’ve learned, BC has been busy diversifying its economy since the 2000s and this is not the same economy it used to be in the 1990s. This diversification adds a layer of protection against economic swings. For instance, Canada’s average unemployment rate is at 5.8% while BC’s unemployment rate is only at 5.3%.
If Canada faces a mild recession this year, BC may be insulated enough to not feel its effects on housing prices. In addition, while interest rates are currently at 6.40%, they are expected to decrease in mid-2024, and we are currently seeing many fixed-rate specials in the 5% range.
If I had to make a bet, I would wager on Vancouver’s housing prices gaining momentum throughout 2024.